Case study
Network Analysis of Political Corruption in Bosnia
United States Institute of Peace · Transparency International · 2021–2025
Mapping the structural relationships between political parties, state-owned enterprises, and corporate actors in Bosnia and Herzegovina — so anti-corruption work can target structure, not just individuals.
Context
The problem
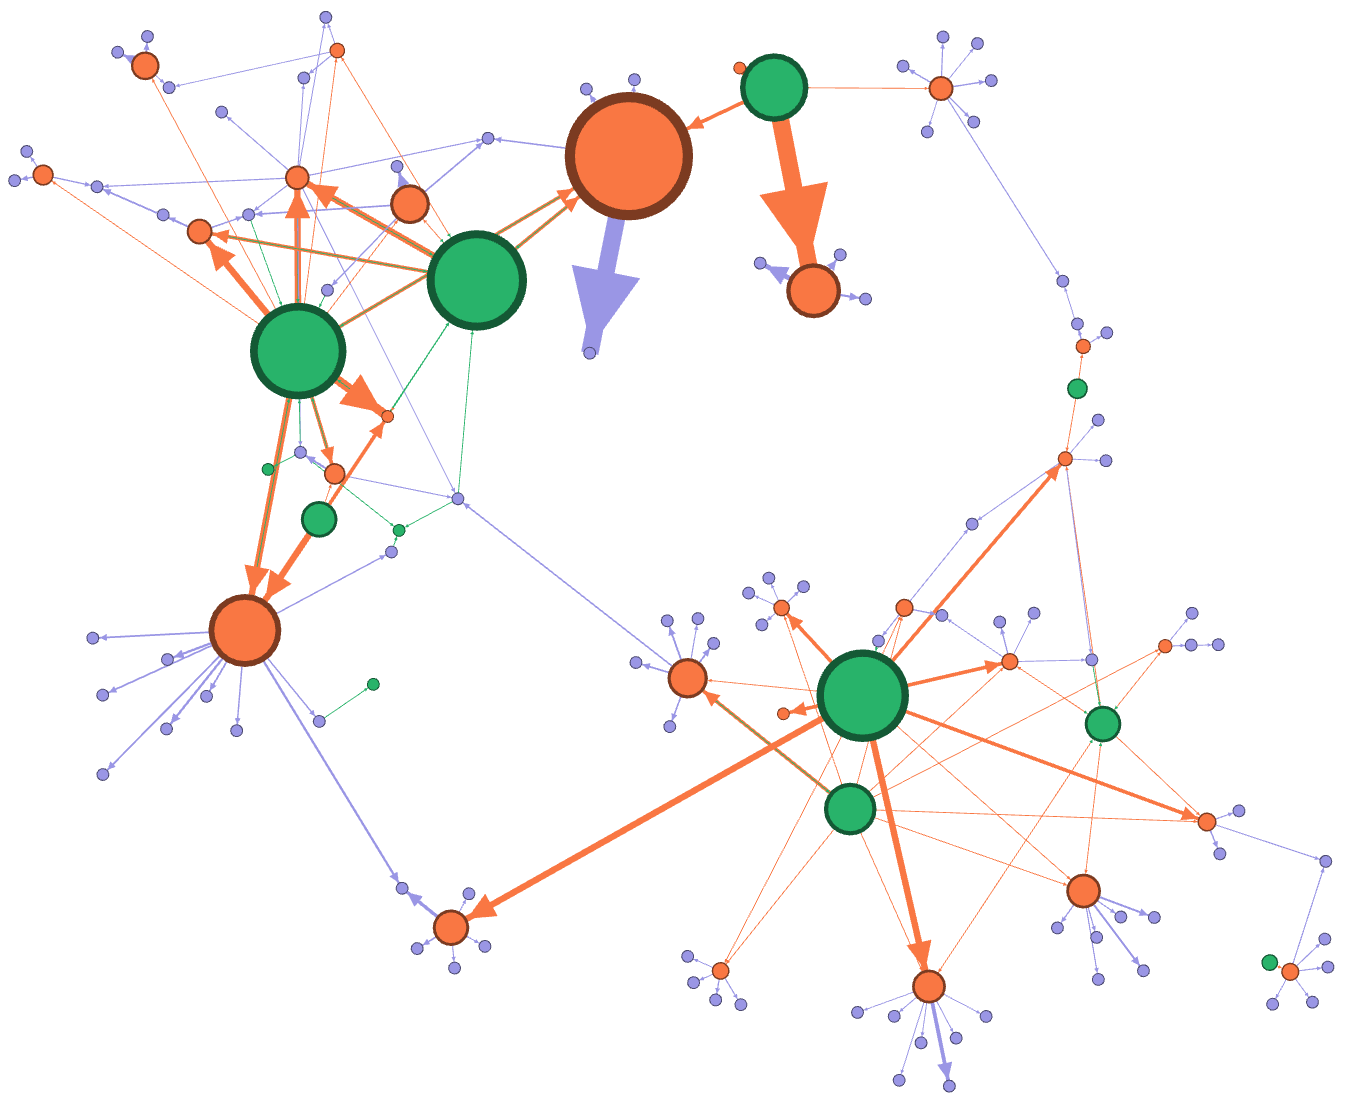
Corruption in Bosnia and Herzegovina is usually described one scandal at a time — a director here, a contract there. But the durable part of the problem is structural: political parties, state-owned enterprises, and corporate actors are connected through shared directors, financial flows, and political appointments, and those connections persist even when individuals change. The question this project set out to answer: where in that political-economic network does influence actually concentrate?
The method
I built a custom data pipeline in Python, using NetworkX and SciKit-Network, to clean, link, and analyze records on three kinds of relationships: shared directors, financial flows, and political appointments. Record linkage carries the most analytic risk in work like this — deciding that two records refer to the same person or company is where errors enter — so the pipeline kept cleaning and linking as explicit, inspectable steps rather than burying them.
On the assembled graph I applied standard centrality measures — betweenness, PageRank, and degree — each capturing a different sense of "influence": sitting on paths between others, being pointed to by well-connected actors, and raw connection count. Where the measures agree, confidence in a hub is higher; where they disagree, that disagreement is itself informative.
The result
The analysis surfaced the hubs of influence within Bosnia's political-economic network. The findings were co-authored into a report presented to the European Council on Foreign Relations and are used by in-country anti-corruption partners. The engagement ran through March 2025. Given the subject matter, I do not name individuals or entities from the analysis here.
Provenance
What traces to what:
- Data. Records on shared directors, financial flows, and political appointments, cleaned and linked in the pipeline. Every edge in the graph traces back to a source record; linkage decisions are where judgment enters, and they were kept inspectable for exactly that reason.
- Code. A Python pipeline built on NetworkX and SciKit-Network. It is not public — the sensitivity of the subject matter argues against publishing the linkage layer.
- Publication. A co-authored report presented to the European Council on Foreign Relations.