A pendulum, a car, two strangers striking up a conversation, the global climate, the seventeen Sustainable Development Goals. These do not seem like they belong on the same diagram, but they do, and putting them on one is the point.
In a chapter Bassel Daher and I wrote in 2021, we argued that any system – physical, social, ecological, economic – can be located along three dimensions. The first is structure: the system's spatial anatomy, meaning how many parts it has, how densely they are interconnected, and how they are layered into vertical and horizontal hierarchy. The second is temporality: how strongly time governs the system, through feedback, cycles, delays, and timescales. The third is chaos: the degree to which the system's behavior is aperiodic (i.e., it never settles into a repeating pattern), whether that randomness comes from genuine chance or, counterintuitively, from a perfectly deterministic equation. Together, these three constitute what we called the dimensionality of systems – a framework for classifying and defining any system, and a space in which every system has an address.
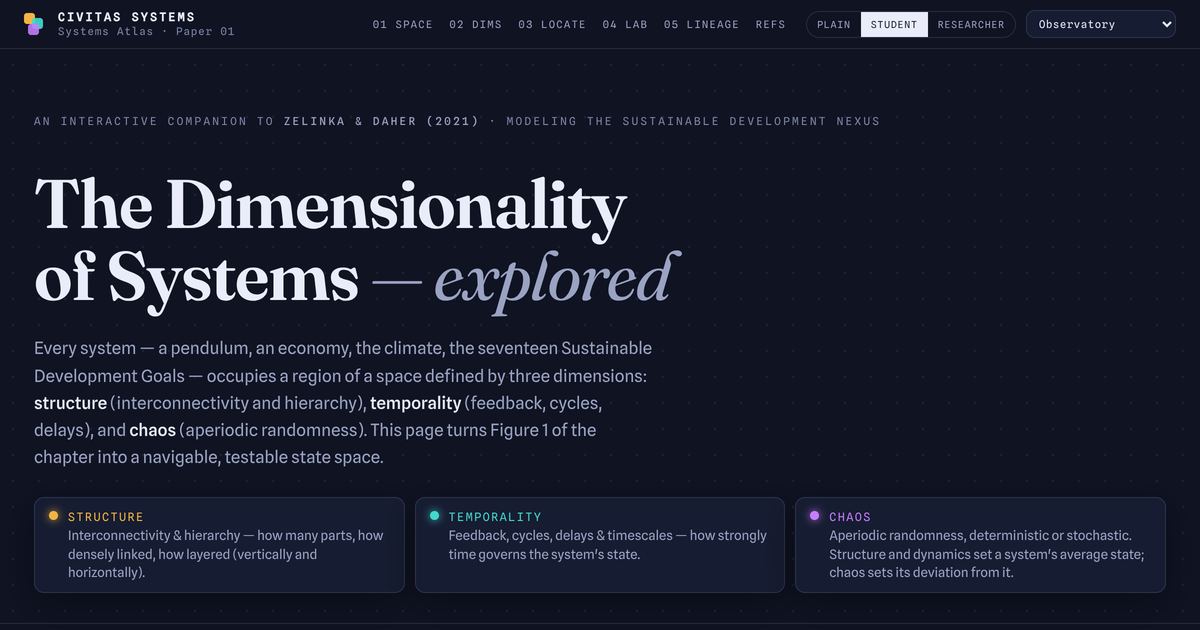
I have now turned that framework, Figure 1 of the chapter, into something you can actually move through: The Dimensionality of Systems – An Interactive Explorer. It is the first page in a series I am calling the Systems Atlas.
The argument
Why bother classifying systems?
Because the type of system tells you which tools will work and what failure looks like when you pick the wrong ones.
A complicated system, like a car, is dense with parts but ultimately knowable. People built it, so people can, in principle, understand all of it: how it works, how to diagnose it, everything. A complex system – a food system, an economy, the climate – cannot be fully comprehended no matter how much effort is put in; there are simply too many parts interacting and doing too many things. That distinction has real consequences. Complicated problems have right answers. Complex problems do not: there is no optimum, only a continuum of possible states, which is why the chapter treats complex outcomes as things understood through ranges of possibilities and average states rather than single answers — the useful move is to make the trade-offs explicit and weigh them, not to chase a single optimum. In fact, if your problem turns out to have no single solution, that is not a failure of effort – it is a reliable indicator that you are dealing with high complexity.
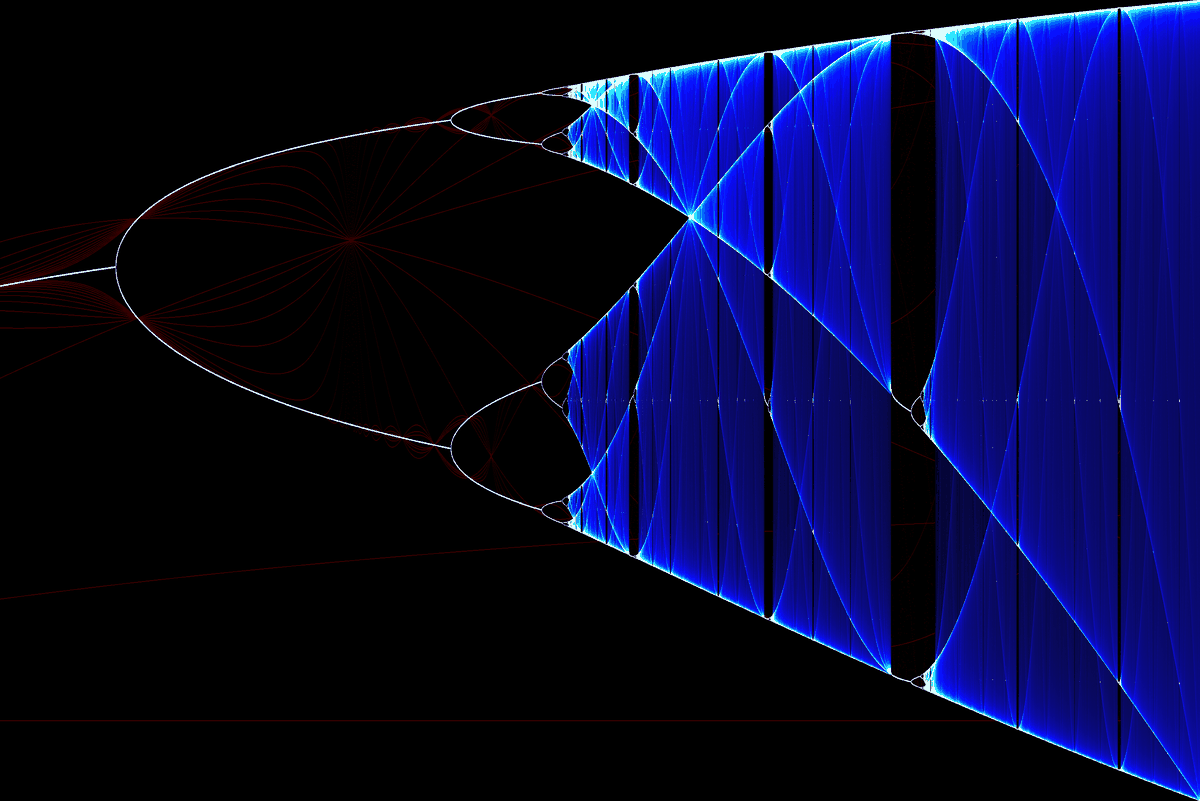
The third dimension cuts across both of the others. Chaos is not a place on the structure–temporality plane; it is a dimension through it, and any system can drift into it when the conditions are met. The logistic map, a simple equation with only a couple of variables, produces behavior that never repeats and cannot be predicted, only given odds. A coin flip arrives at the same place by pure chance. Deterministic or stochastic, the practical meaning is the same: a chaotic system's state is best described not as a point but as a distribution.
That last sentence is the heart of the page's design. As we put it in the chapter, structure and dynamics describe a system's average state, while chaos describes its variance and deviation from that mean. So on the page, no system is drawn as a dot. Every system is drawn as a credible region – a cloud of plausible positions around a wandering mean – and the cloud widens as chaos grows.
The fuzziness is not decoration; it is the claim.
The explorer
What you can do on the page
The explorer is meant to be played with, not just read. A few things to try:
Fly the space. Fourteen systems, from the pendulum to the SDG nexus, float in 3D as credible-region clouds. Click any of them and you get the rationale for its placement plus its three nearest neighbors. Then try the plane views: each 2D projection names a pair of systems that collide in two dimensions but sit far apart on the axis you dropped. A coin flip and a pendulum look like neighbors until you restore the chaos axis – which is the argument for needing all three dimensions, made visually.
Build each dimension yourself. Three playgrounds generate the axes from scratch. Wire up a network node by node and watch a structure score rise with density. Tune a reinforcing loop against a balancing loop with a delay between them and watch oscillation emerge (i.e., a cycle born from delay, the basic system dynamics result). And turn up the interaction dial on a simulated flock: with the dial at zero you have individual birds, and as interaction strengthens, one shape appears in the sky that no single bird knows how to make. Two strangers plus one relationship: in systems, 1 + 1 = 3.
Run the chaos lab. Twin logistic-map trajectories that start 0.0001 apart, a clickable bifurcation diagram, and a live Lyapunov exponent (the standard measure of how fast nearby starting points fly apart). Push the growth parameter r to 4.0 and λ reaches +0.69; one click sends that measurement to the classifier as a chaos coordinate, using the lab as a measuring instrument for one axis.
Locate your own system. Set the three sliders, along with a fourth for how confident you are in your placement, and a fuzzy classifier – 400 Monte-Carlo samples, in the spirit of Zadeh (1965) rather than crisp boxes – reports which family your system most plausibly belongs to and which methods suit it. Then test your intuition in the predict-then-reveal game: five systems, you commit your guesses, the canonical placements are revealed, and the space scores you.
Read at your level. Everything substantive comes in three reading lenses – Plain, Student, and Researcher – from the opening paragraph down to each system's blurb, with the Researcher lens carrying the citations and formalism. There are also twenty-four visual themes — eight of the explorer's own plus the site's sixteen — because reading environments differ.
Throughout, every dataset is also a table and a CSV download, every figure is numbered, and a Methods appendix separates what is the chapter's from what is operational. The constants I chose to make the framework renderable are flagged as mine to tune, not as claims, and where the page extends past the chapter (e.g., a trajectory's final waypoint, the illustrative climate path), the label says so.
What's next
Where this is going
This page is the template for the Systems Atlas: the design system, the reading lenses, and the numbered-figure format established here will carry into the pages that follow. The chapter's second half – the system dynamics model of the SDGs and the insecure→secure archetype – is deliberately out of scope here and will get its own page. If you want a preview in the meantime, the STELLA model is public, and a companion draft essay on the SDG nexus as a complex coupled system is already on the Atlas.
Explore the space
Fourteen systems, three playgrounds, a chaos lab, and a fuzzy classifier – the framework as a place you can move through rather than a figure you look at.
Sources
Citations
Zelinka, D., & Daher, B. (2021). Modeling the Sustainable Development Nexus as a Complex-Coupled System: System Dynamics Modeling. In Handbook of Research on Modeling, Analysis, and Control of Complex Systems (ch. 2). IGI Global. doi:10.4018/978-1-7998-5788-4.ch002
Zelinka, D., & Amadei, B. (2019). A Systems Approach for Modeling Interactions Among the Sustainable Development Goals — Part 1: Cross-Impact Network Analysis. International Journal of System Dynamics Applications, 8(1), 23–40.
Zelinka, D., & Amadei, B. (2019). A Systems Approach for Modeling Interactions Among the Sustainable Development Goals — Part 2: System Dynamics. International Journal of System Dynamics Applications, 8(1), 41–59.